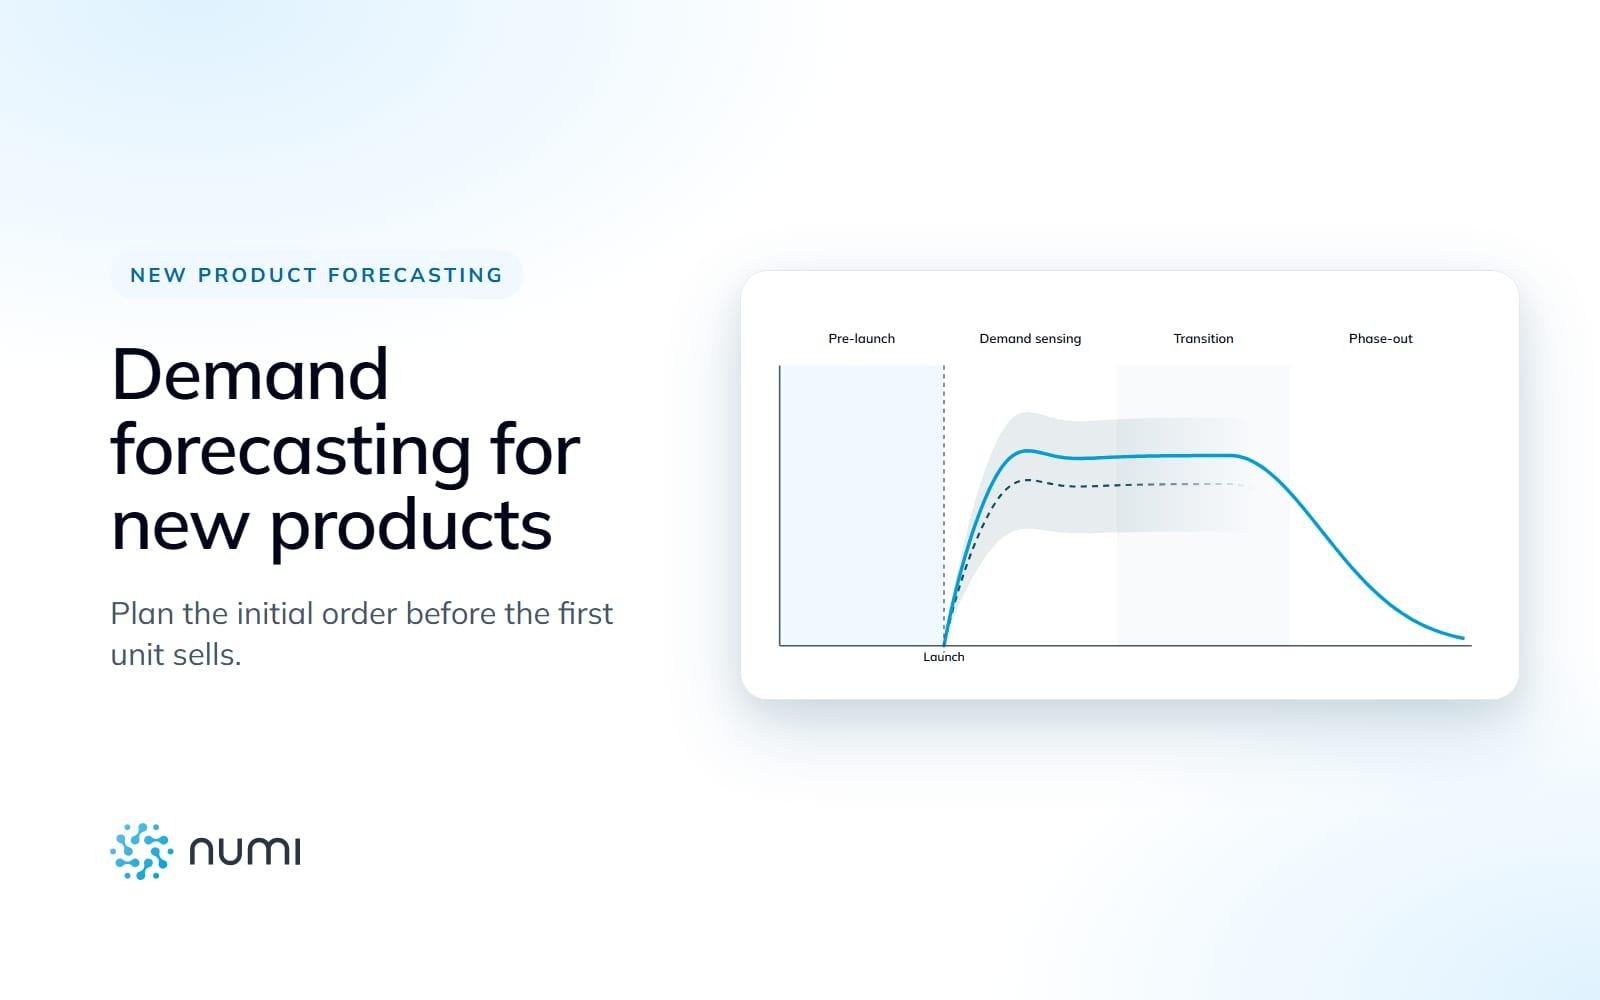

New product forecasting decides how much stock is available at launch – long before the first unit sells. A prominent example is currently showing how expensive it gets when that forecast is wrong.
On October 23, 2026, Apple's first foldable smartphone, the iPhone Duo, went on sale. Starting price: $1,999, with the 2 TB version at $3,199. The first batch sold out quickly, and according to reports the next delivery is not expected until January 22, 2027.
The cause: according to market researchers, the original production target for 2026 was 6 million units. Based on pre-orders and post-launch demand, it was raised to 8 to 10 million. Taiwanese media, citing industry sources, report that Apple increased its orders with suppliers by 30%. The reports also point to yield problems in assembly as a further reason.
A rough estimate puts Apple's missing revenue this year at around $4 billion, and in the worst case as much as $8 billion. The math is simple: 2 to 4 million units short, multiplied by the $1,999 starting price. And that is a conservative estimate, because many buyers choose the more expensive storage option.
Some customers will wait until January. But those who switch to Samsung are gone. And the margin from reselling at inflated prices goes to resellers instead of Apple.
If even a company with pre-order data and huge analytics teams misses by 25 to 40%, a single number from a sales meeting is no basis for planning. The decisive commitment, the initial order with the supplier, is made months before the first sale. That is exactly where good demand forecasting for new products comes in.
Key takeaways
- A new product has no sales history of its own, but almost always has comparable data: predecessors, attributes, previous launches, test markets.
- A new product forecast has two parts: the volume (how much) and the curve (when). Each method delivers one or both parts.
- The methods can be combined: volume from attributes or like items, curve from previous launches. Scenarios are an additional safeguard, not a must.
What is new product forecasting?
New product forecasting estimates how many units of an item will sell before it has a sales history of its own. Instead of the missing history, it uses other evidence: comparable items, product attributes, previous launches and test sales. After launch, it is continuously updated with actual sales.
It is also called NPI forecasting (NPI stands for New Product Introduction), and in data science the cold-start problem. The difference from regular demand forecasting: there, a model detects patterns in an item's own history, such as seasonality, trend and promotion effects. For a new product, the signal has to be borrowed from elsewhere.
Why new product forecasts so often miss
Most forecast errors are not caused by bad models but by a bad process. We see four patterns again and again in practice:
- The frozen sales number: A quantity from the sales or buying meeting ends up in an Excel cell and is only adjusted by hand for months.
- Only the quantity, not the curve: The total quantity for the season is planned, but not when it will sell. The total may be right, yet stock is missing at launch or sits in the warehouse too early.
- The cherry-picked comparison item: The bestseller is chosen as a reference, not the most similar item. Flops drop out of the comparison, and the forecast inherits the optimism.
- Forgotten cannibalization: The new product takes sales away from its predecessor or sister item. If this is ignored, both end up overstocked.
The common core: the initial quantity is set before launch and can hardly be corrected afterwards. With lead times of three to six months, as is common in fashion or for imported goods, the pre-launch forecast is the actual decision. Everything after that is damage control or fine-tuning.
The four phases of a product's life in planning
From a planning perspective, every new product goes through four phases: the pre-launch forecast, the first weeks after launch, the transition to regular demand forecasting and the phase-out. The first phase has the greatest impact, because that is where the initial quantity and the options with the supplier are set.
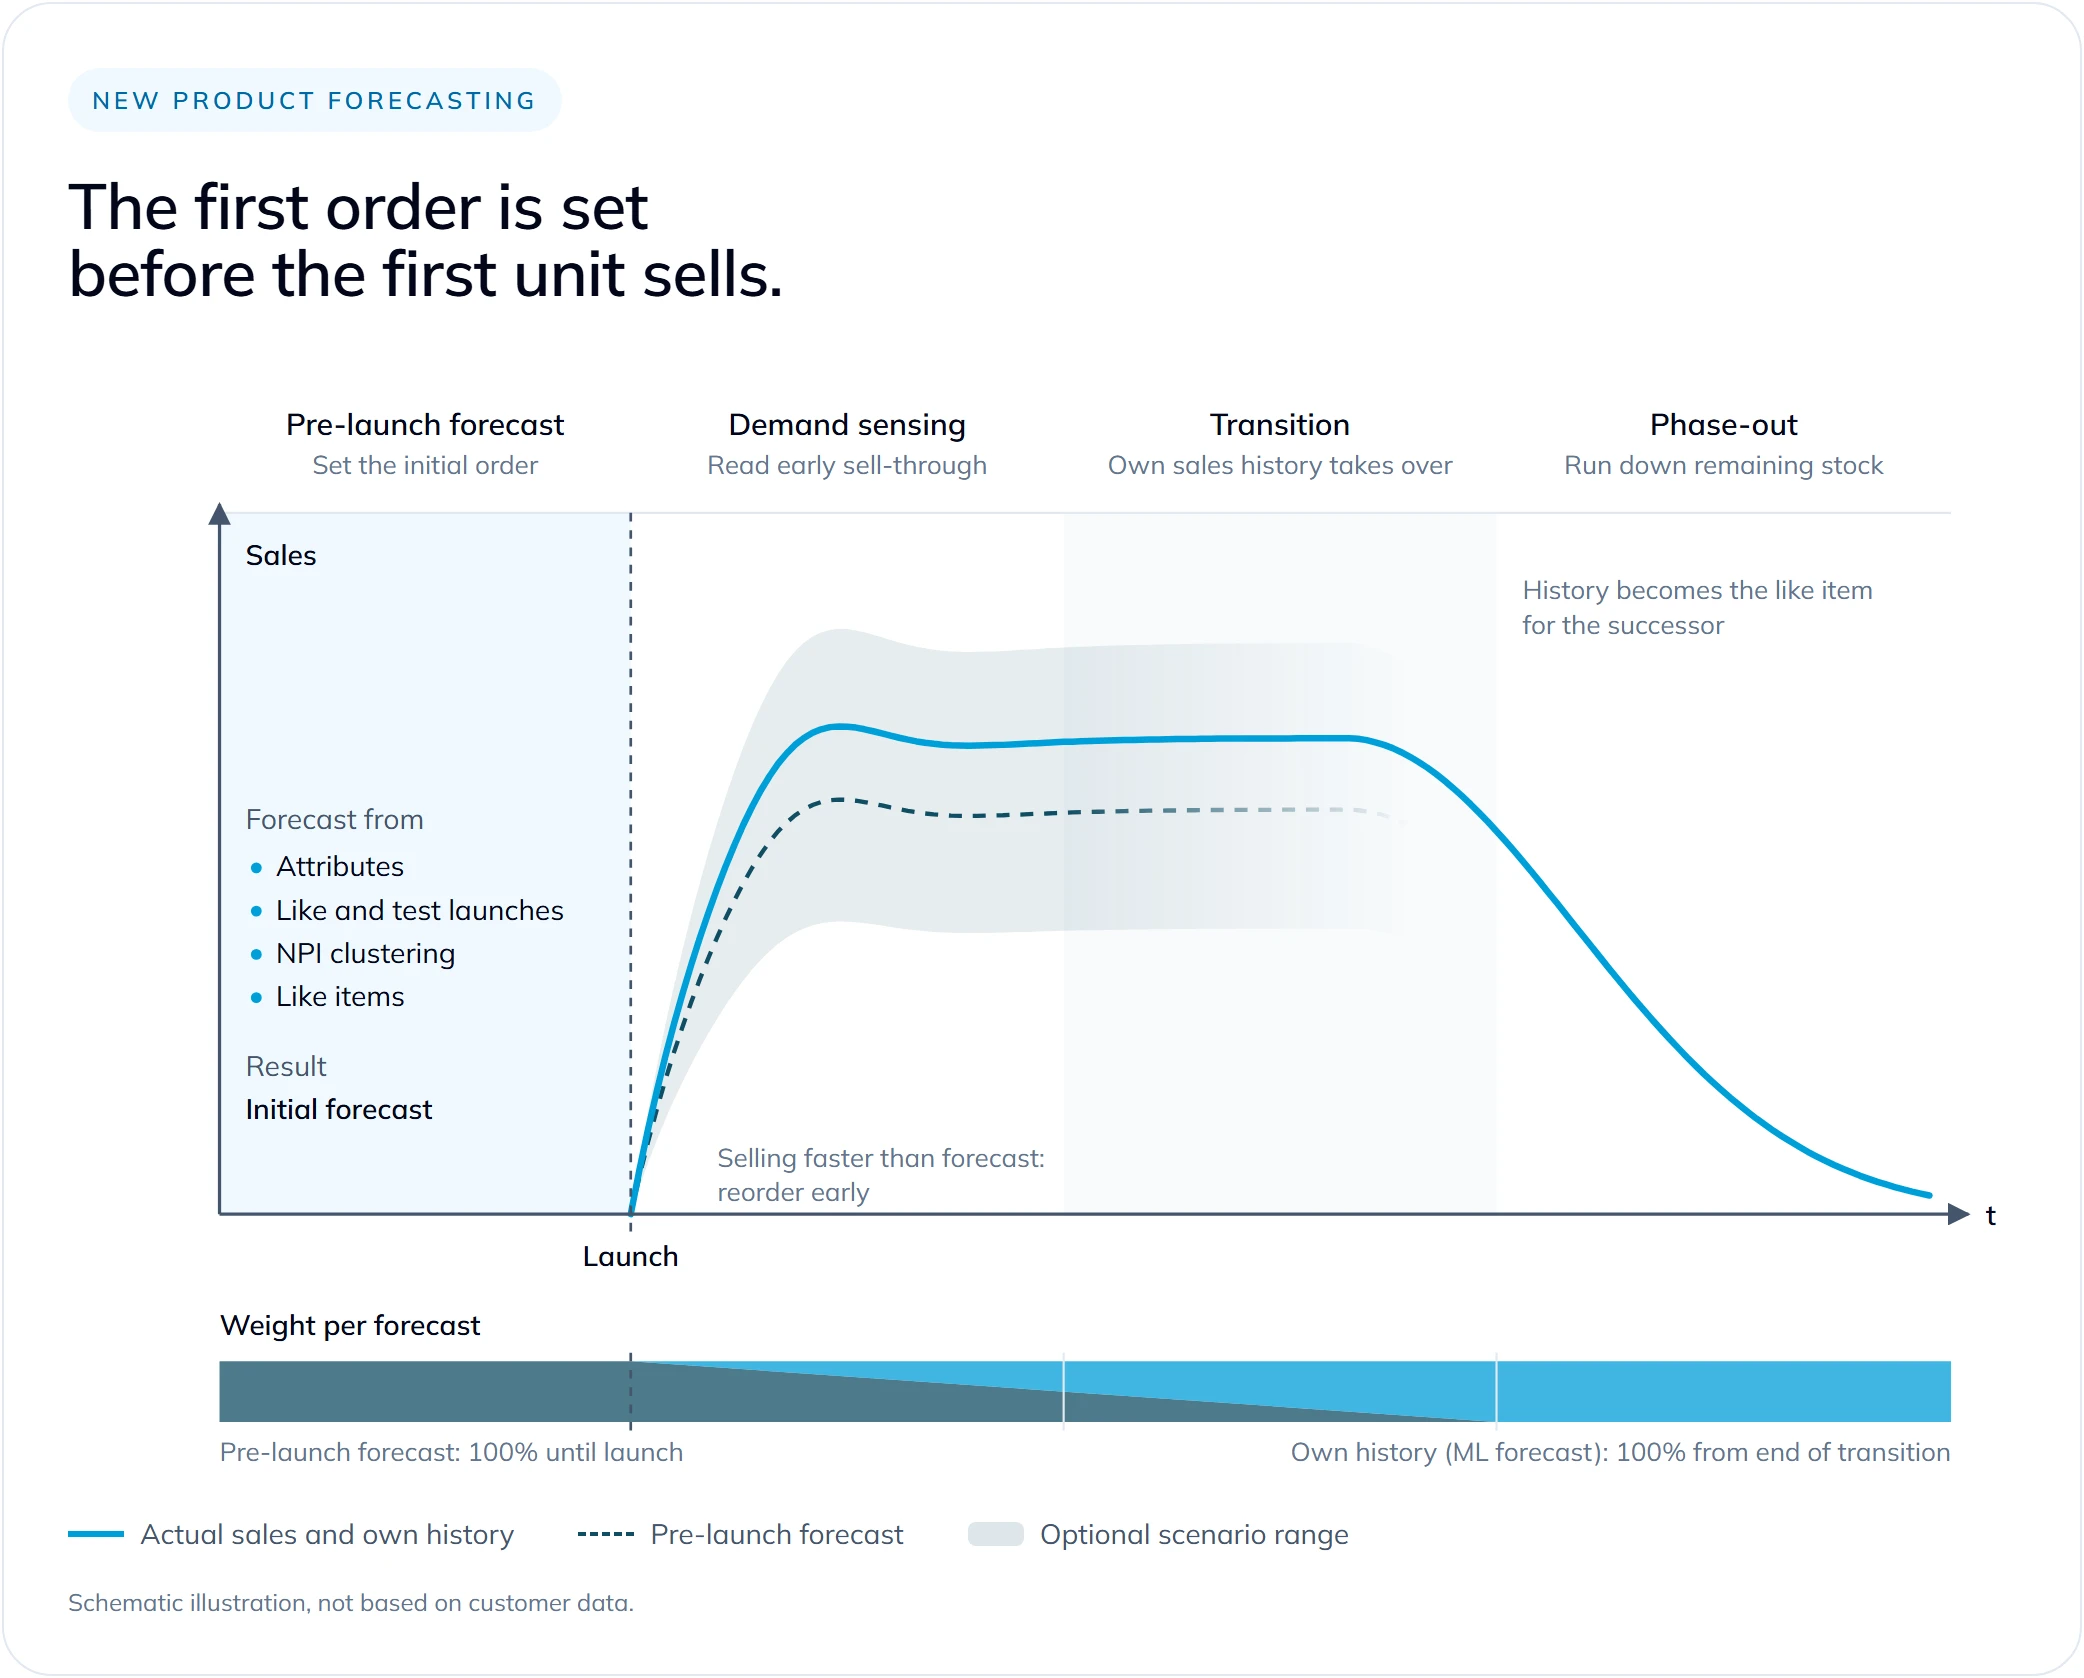
Before launch, the forecast from comparable data carries the full weight. From launch onwards, the weight shifts week by week to the item's own history until it is forecast like any other item.
Four methods for the pre-launch forecast
Every new product forecast has to answer two questions: how much will be sold in total (volume), and how is that distributed over the weeks after launch (curve)? The following four methods each deliver one of these parts or both. In practice, they are combined.
1. Attribute-based planning
How it works: A machine learning model learns from all previous launches how attributes such as product group, price point, material, color, pack size, channel and season relate to early sales. For a new product, its attributes from the item master are then enough; a planner does not have to search for comparison items by hand.
When it fits: For large assortments with many new launches per year, for example in fashion or consumer goods. New tabular foundation models can also produce such forecasts with little training data of your own.
Delivers: mainly the volume.
Risk: Incomplete or inconsistent master data. An attribute value the model has never seen (a completely new product group) is hard to forecast.
2. Like launches and test launches
How it works: Both methods use actual sales data of the new product from a smaller part of the market. In a like launch, the product has already launched in another country, channel or store group, for example in a staggered rollout. How it performed there is transferred to the remaining markets and scaled to their size. A test launch follows the same principle, only on purpose: the product deliberately launches first in a few stores or one region to learn before the big rollout.
When it fits: For staggered launches across countries, channels or stores, and whenever there is enough time between the first launch and the rollout for a reorder.
Delivers: volume and curve, based on actual sales of the new product rather than comparison items.
Risk: The reference market has to match the target market. A launch in a few stores says a lot about those stores and little about the rest. And the first deliveries to retail are initial stocking, not end-customer demand.
3. NPI clustering
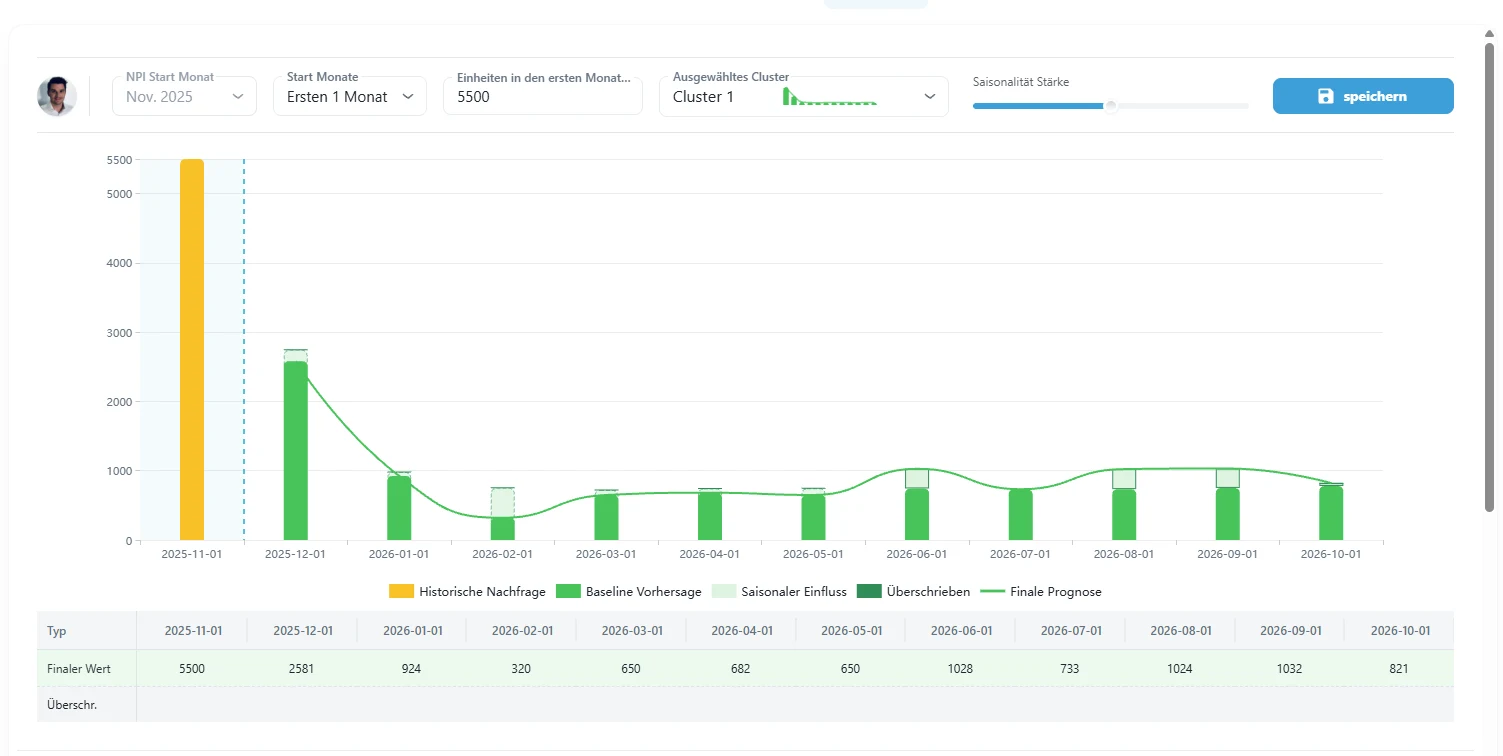
How it works: All previous launches are grouped by the shape of their launch curve. Typical clusters include the fast starter with an early peak, the slow ramp-up, the seasonal spike and the flop. A new product is assigned to a cluster via its attributes and takes over its typical curve.
When it fits: Whenever the volume comes from another method but the curve is unclear. The combination "volume from the attribute model or like item, curve from the cluster" is often the strongest in practice.
Delivers: the curve, i.e. the distribution over the weeks after launch. This is crucial for deciding when which quantity has to be in stock.
Risk: Too few historical launches for stable clusters. In that case, a few broad clusters are better than many fine ones.
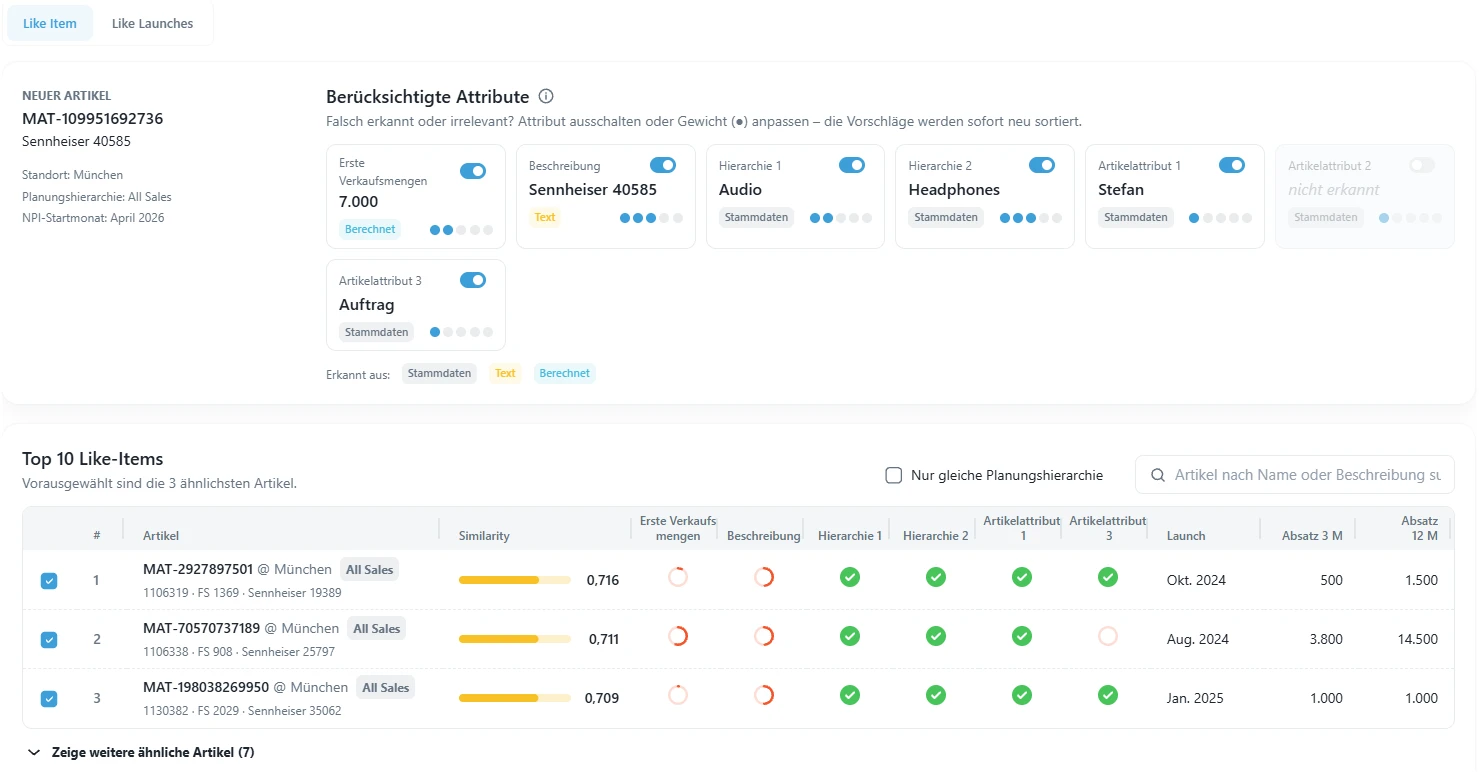
4. Like item (comparison item)
How it works: You choose one or more existing items that are as similar as possible to the new product and take over their sales history. This is then scaled, for example to the planned number of stores, customers or channels, the price point and the marketing push.
When it fits: For successor items, color and size variants, new pack sizes and seasonal re-releases. There is almost always a good comparison here.
Delivers: volume and curve.
How to choose good like items: What matters are the drivers of sales, not the brand: product group, price point, sales channel and launch season. Define the like items before you look at their numbers, and deliberately include items with a weak start. Two to three like items averaged are more robust than one.
Risk: A like item that was chosen because it confirms the plan.
Additional option: scenarios
Regardless of the method, the forecast can be complemented by a cautious and an optimistic scenario. This is particularly worthwhile for long lead times and high risk. The range can be derived from the deviation of previous launches. The upper limit does not have to be ordered as goods: it is often enough to reserve material and production capacity with the supplier. For the iPhone Duo, exactly that could at least have shortened the shortage.
Which method when? The decision matrix
Start with the question of what evidence you have, then read the row.
| Available evidence | Method | Delivers | Main risk |
|---|---|---|---|
| Only attributes in the item master | Attribute-based planning (ML) | Volume | Incomplete master data, completely new attribute values |
| Sales from an earlier launch in another country, channel or test stores | Like launch or test launch | Volume and curve | Unrepresentative reference market, initial stocking mistaken for demand |
| Many historical launches | NPI clustering | Curve | Too few launches for stable clusters |
| Close predecessor or sister item | Like item with scaling | Volume and curve | Cherry-picked comparison, overlooked cannibalization |
The rows are not mutually exclusive. Most launches have two types of evidence, and the best forecast combines them: for example, the volume from the attribute model, cross-checked against the like item, and the curve from the matching cluster. If no row really fits because it is a completely new category, uncertainty is high. That is when the additional safeguard of scenarios pays off most.
After launch: demand sensing, transition and phase-out
This article focuses on the pre-launch forecast. But three things are essential so that a good launch forecast does not go to waste.
Demand sensing in the first weeks. From the first day of sales, actual sell-through is compared with the forecast daily or weekly. If the item sells better than expected, reorder early; if it sells worse, reduce the reorder. Important: use sales to end customers (sell-out), not deliveries to stores (sell-in), because the latter include initial stocking. How a new product's forecast can then be allocated to individual stores is described in our article on assortment planning in retail.
Transition to regular ML forecasting. The launch forecast should not keep influencing decisions forever. With every week of actual sales, the weight shifts from the pre-launch forecast to the item's own history until, after a few weeks, it is forecast like any other item. Fast movers get there sooner than slow movers.
Phase-out planning. The end is part of planning too: manage remaining stock so that the item runs out without large write-offs, and link the successor in good time. The history of the outgoing item then becomes the like item for the successor, and the cycle starts again.
And if a launch flops? If sales are well below forecast after a few weeks and there are many weeks without sales, the item belongs in a method for intermittent demand instead of continuing to be overestimated by a regular model.
Examples from fashion, consumer goods and wholesale
Which evidence is available before and after launch differs by industry. For brands and retailers with large assortments and many new launches per season, new product planning is part of our solution for e-commerce and retail.
| Industry | Typical new launch | Evidence before launch | Signals after launch |
|---|---|---|---|
| Fashion/sports | New collection, color variant, seasonal item | Predecessor from the previous season, attributes such as fit, material, color and price point, launch clusters | Sell-through rate per store and size, returns |
| Consumer goods (CPG) | New flavor, pack size, new listing at retail | Sister items, retailer listing commitments, promotion calendar | Retail sell-out data, repeat purchase rate, initial stocking vs. demand |
| Wholesale | New supplier or replacement for a discontinued item | Discontinued item as like item, customer orders, attributes | Incoming orders, number of ordering customers |
How numi supports new product forecasting
In numi, all four methods from this article are part of demand planning: like items, attribute-based planning, like and test launches, and NPI clustering. Planners can use them individually or combine them, for example the volume from the attribute model and the curve from the matching launch cluster.
The entire lifecycle runs in one system: the pre-launch forecast, with scenarios if required, demand sensing after launch, the automatic transition to regular ML forecasting and finally phase-out planning with a link to the successor. Through around 20 ERP integrations, master data and sales come directly from your ERP system.
Frequently asked questions
How do you forecast demand for a new product?
With the evidence that is available. If there is a similar item, its sales are scaled to distribution, price and marketing (like item). If there is none, a model estimates sales from the product attributes. The curve over time comes from previous launches or launch clusters.
What is a like item?
A like item is an existing item whose sales history serves as a template for a new product. Good like items match the new product in product group, price point, channel and season.
How much should I order for the initial order?
As much as you are likely to sell until the first possible replenishment. To work this out, you need the curve of the first weeks in addition to the total quantity, for example from a matching NPI cluster. You manage the rest through reorders.
How accurate are new product forecasts?
Considerably less accurate than for established items, and there is no cross-industry benchmark. More important than a single accuracy figure is measuring your own deviation across recent launches and using it to improve the methods launch by launch. Which metrics are suitable for this is shown in our article on forecast KPIs.
What does NPI mean in supply chain?
NPI stands for New Product Introduction. In the supply chain, it covers all planning steps from concept to market launch: demand forecasting, capacity and material planning, and the initial order.
Conclusion: the most important forecast is made before the first sale
New products are not a black box. With like items, product attributes, previous launches and launch clusters, sales can be reliably estimated before launch, both in quantity and curve. If you plan this way, you set the initial order deliberately and react within days after launch instead of months.